

In Monday’s New York Post, James Merriman highlights several additional findings from the 2011-12 New York City Progress Reports, based on the full data set now available on the NYC DOE website. (Our initial analysis of the top-level letter grades can be found here.) The full data set provides numerical detail around several important trends, which we’ll illustrate claim-by-claim:
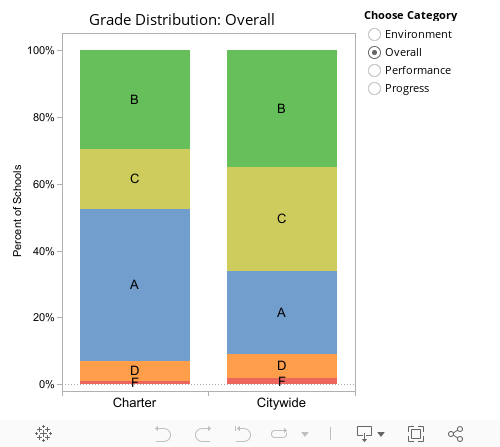
“…Charter schools won higher grades – both overall and in every subcategory, including students’ academic growth over time compared to other schools that share the same population.”
Explore the letter grade distribution for the “progress”, “performance” and “environment” subcategories for charter schools as compared to the fixed distribution of grades given to schools citywide in the chart to the right.
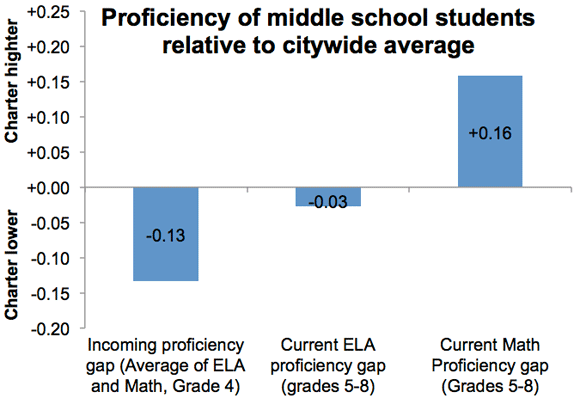
“Charter middle schools take students who were performing below the citywide average in math and English in elementary school and move them ahead of the city average in math while narrowing the gap in English.”
Here we used the machinery behind the Progress Report’s middle school “peer index” to examine the incoming and current proficiency of students at charter middle schools. The major input for the middle school “peer index” is the average proficiency level of each of the school’s students from before they were at the school, that is, when they were in grade 4. We took these values and compared them to the students’ average current proficiency. Note that while the incoming grade 4 proficiency is presented in the NYC DOE data set as a numerical average of math and ELA together, the current proficiency is available by subject.
| Charter | Citywide | |
| Incoming proficiency (Average of ELA and Math, Grade 4) | 3.07 | 3.21 |
| Current ELA Proficiency (Grades 5-8) | 2.79 | 2.82 |
| Current Math Proficiency (Grades 5-8) | 3.33 | 3.17 |
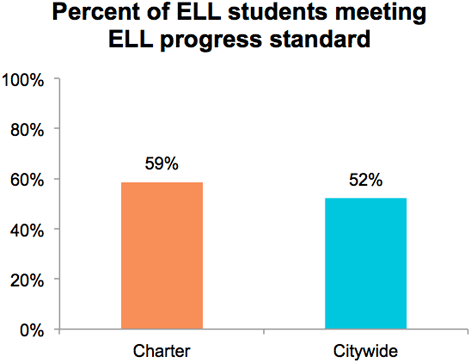
“English Language Learners at charter schools become proficient in English at faster rates. Citywide, many immigrant students take five years or longer to learn the language; charters get the job done more quickly.”
The “ELL progress” standard is based on the percent of ELL students who either improved from 2011 to 2012 on the NYSESLAT, took the NYSESLAT for the first time and scored “intermediate” or higher, or who improved to a score of 3.0 or higher on the New York State ELA exam in 2012. See the progress report methodology, page 12, for more details.
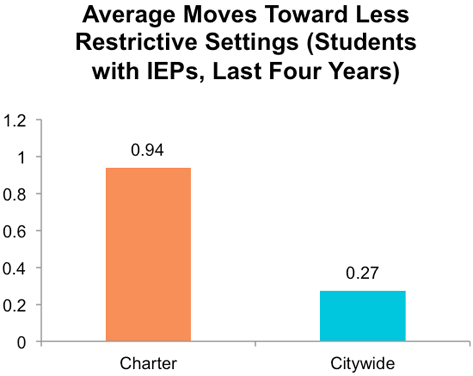
“Special-education students in charters are more likely to move, either into general-education status or into less restrictive settings (such as a mainstream classroom with extra support). In a city with extremely high rates of special-ed classification, particularly for black and Hispanic male students, this, too, is significant progress.”
A move toward a less-restrictive setting is defined as a student spending a smaller portion of their time receiving special education services than at some time in the previous four years. Information for the time classifications used for this measure can be found on the progress report methodology, pages 11-12.
Blog exclusive: Charter school students with disabilities outperform citywide averages within all three service types in math, and in two of three service types in ELA.
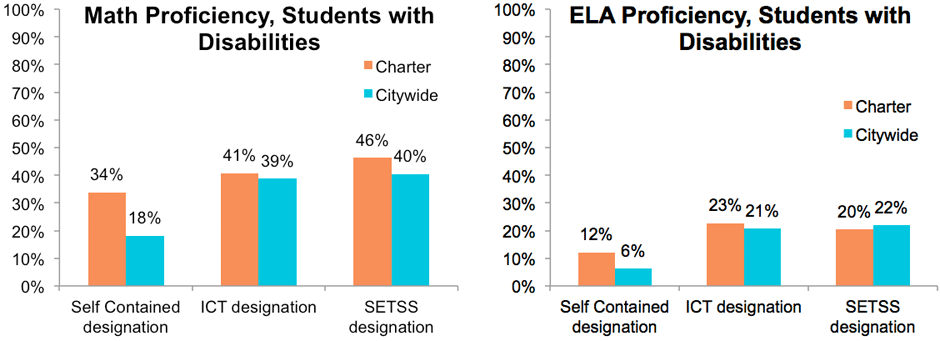
The “Closing the Achievement Gap” section of the Progress Reports provides subgroup performance statistics for students with disabilities, broken down by whether they are served in self-contained settings, Integrated Co-Teaching (ICT) settings, or a “push-in/pull-out” Special Education Teacher Support Services (SETSS) capacity. While these subgroup classifications allow for some comparisons, students at charters may still differ in terms of their disability type and/or their amount of time receiving special education services, which are distinctions not captured by the current Progress Report methodology.
*Note on weightings and exclusions: Sector-wide averages are for schools receiving Early Childhood or Elementary/Middle School progress reports, and therefore do not include high schools or District 75 schools, for which 2011-12 progress reports have not yet been released. Comparisons are weighted by student enrollment, or by the product of enrollment and subgroup population, where available.